
VMware Skyline – An Adventure with API and PowerBI – Part 2
This is Part 2 of this series, where I take an adventure through using Skyline APIs with PowerBI. The first part of this series looked at making sure you had the correct rights within Skyline Advisor, how to generate the Access_Token that is required to access the API data and how to test that using the GraphiQL capability built into the Skyline Advisor web page.
This part of the series is focused on how to get the data into PowerBI from the Skyline API. We will not be automating the process from start to finish in this part of the series as that would require us to automate the generation of the Access_Token which will be covered in a later part of the series.
Part 1 of this series can be found here:
https://www.virtualworlduk.co.uk/wordp/2023/10/12/vmware-skyline-an-adventure-with-api-and-powerbi-part-1/
Part 3 of this series can be found here:
https://www.virtualworlduk.co.uk/wordp/2023/10/19/vmware-skyline-an-adventure-with-api-and-powerbi-part-3/
Getting Data Into PowerBI
As mentioned at the end of the last section, we’re going to take a look at how to get the data into PowerBI from the Skyline API but at this stage we will be manually adding the access_token – this will mean that you’ll need to update the access_token every time you refresh the PowerBI data (unless you refresh the data within about 5 minutes of generating the access_token)
We’ll be looking through the process of this by utilising the ‘Advanced Editor’ in PowerBI, and we’ll try to break down each item to explain a little more about what we’re trying to do. You can also skip to the end of this part where I’ll provide the full code from the ‘Advanced Editor’.
Accessing the Advanced Editor in PowerBI
This is the process that I would do to get into the Advanced Editor in a new PowerBI file.
Start up PowerBI Desktop, click on the ‘Transform data’ entry at the top of the screen – this will take you to the Power Query Editor.
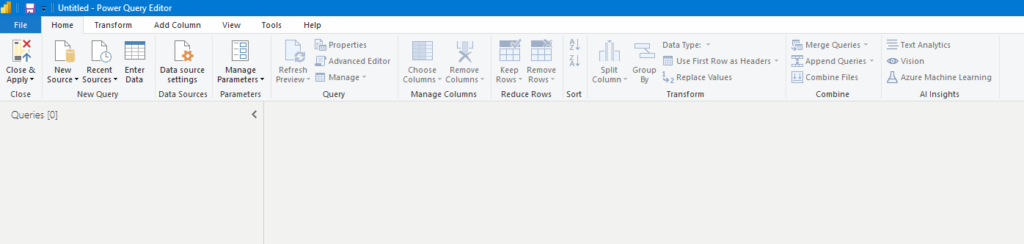
As this is a new file, you won’t see any queries listed.
Click the drop down arrow by the ‘New Source’ entry at the top of the screen, to open a menu. From the menu select ‘Blank Query’
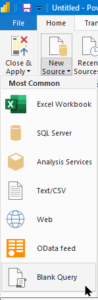
This will now create a new query called Query1.
To access the Advanced Editor, we will now right mouse click on Query1 and select the ‘Advanced Editor’ option.
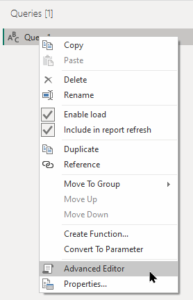
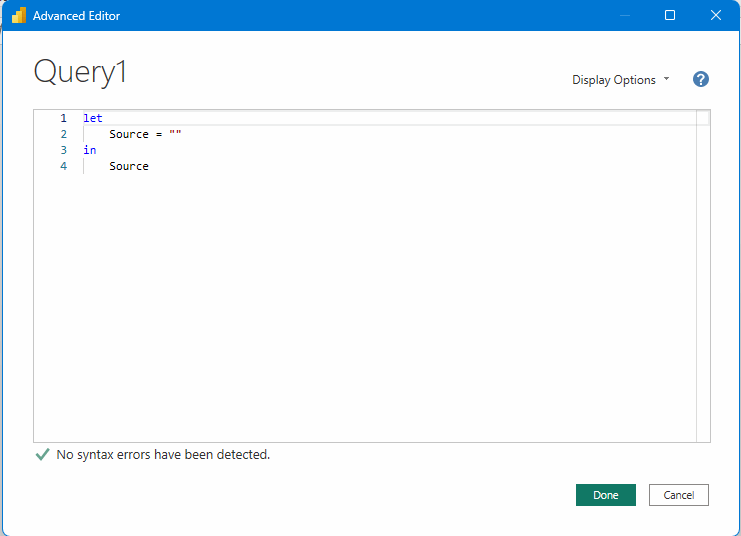
You should now be presented with the ‘Advanced Editor’ pane that should look similar to below
Body Information
The first part of the code that we’ll be entering is the code that we’ll use to choose exactly what data we’ll be asking to have returned from the API connection.
We’ll call this the ‘body’ of the data.
    body = "{
       ""query"":""
         {
       activeFindings(limit: 1000) {
         findings {
           findingId
           accountId
           findingDisplayName
           severity
           products
           findingDescription
           findingImpact
           recommendations
           kbLinkURLs
           recommendationsVCF
           kbLinkURLsVCF
           categoryName
           findingTypes
           firstObserved
           totalAffectedObjectsCount
          }
           totalRecords
           timeTaken
        }
      }"",""variables"":{}}",
If you head over to the VMware Skyline documentation here: https://docs.vmware.com/en/VMware-Skyline/1.0/skyline-api-guide/GUID-92213394-4ADD-4A35-BD36-DC77397E249D.html
You’ll notice that what we are entering in our body is similar to the POST command that you would enter into the GraphiQL explorer interface in Skyline Advisor to take a look at the active findings.
In the above code block we are saying that we would like to query the data to gather the active findings with a limit of 1,000 (although the limit may only be 200).
The fields in the results that we would like to gather are listed under the ‘findings’ section.
If you notice the first part of the code includes the variable ‘body’. This is therefore saying that the variable ‘body’ contains all of the other text in this first piece of code. This will allow us to use the variable later in our code rather than entering all of the information. This makes is easier to read the code and also allows for the variable to be reused multiple times later in the code, if needed.
This part of the code can be pasted into the ‘Advanced Editor’ under ‘let’ but replacing the ‘source’ information already listed.
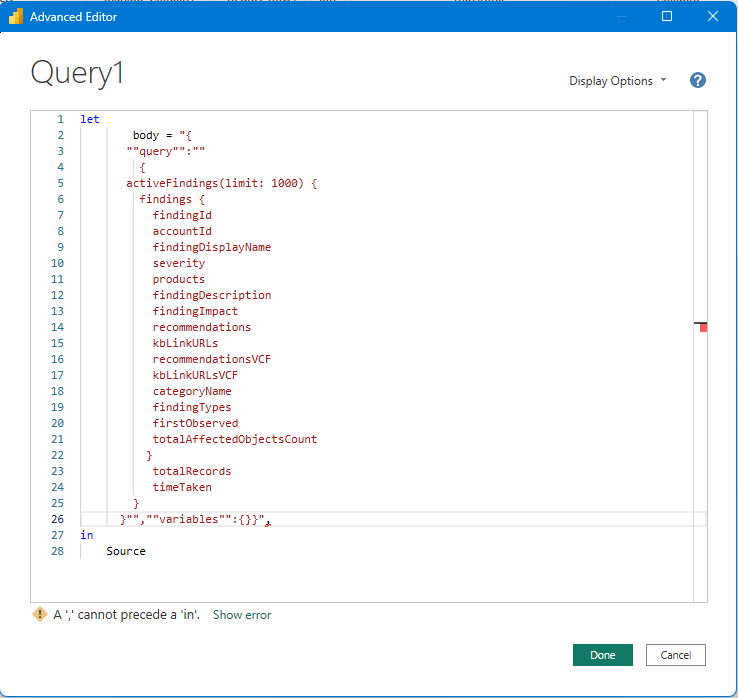
Do not worry about the errors being shown at the moment, this is because the query isn’t complete. We’ll continue to build up the query in the next section.
Data Information
The next section that we will be adding to the query is the Data section.
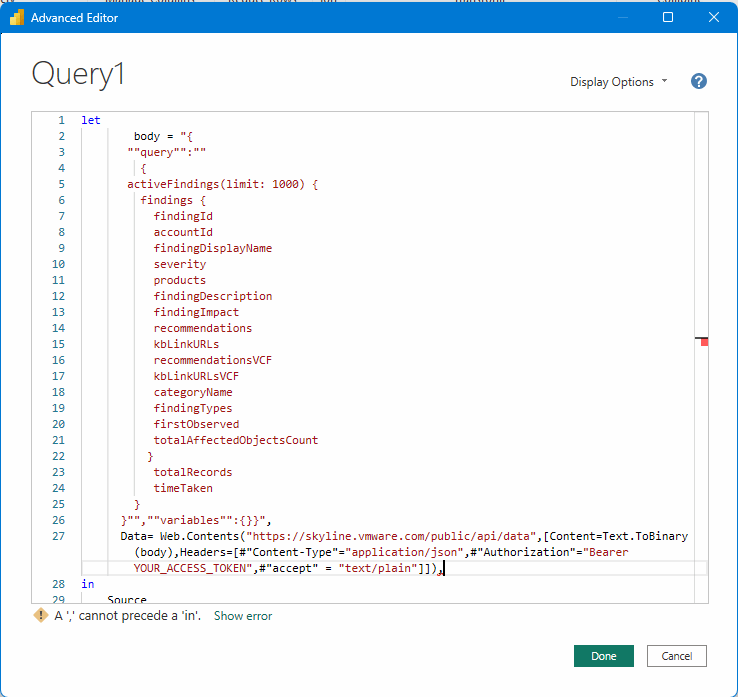
Data= Web.Contents("https://skyline.vmware.com/public/api/data",[Content=Text.ToBinary(body),Headers=[#"Content-Type"="application/json",#"Authorization"="Bearer YOUR_ACCESS_TOKEN",#"accept" = "text/plain"]]),This is the part of the query that explains where we are going to get the information from and how we are going to connect.
Make sure that you change the ‘YOUR_ACCESS_TOKEN’ entry across to the access token that you generated in part 1… also remembering that the access token only has a limited life and therefore may need to be regenerated to run the query.
This is the section that is likely to need to be edited before each refresh of the data and will be part of the area that we look at when we try to automate the generation of the access token in a later part.
If you notice on this code, we are creating the variable ‘Data’ (which we’ll use later) and in the process we are saying to utilise the information we have entered in the ‘body’ variable at the top of the query.
Your query should be looking similar to below
Additional Items
The additional items section is where we pull the previous information together. To avoid us having to have all of the previous information added as part of the same lines as the following information, we have been assigning the previous information to variables which will then be used in the following code. When it comes to updating the information or making changes, we therefore only need to make changes in the variable entries rather than, potentially, multiple times throughout the rest of the query.
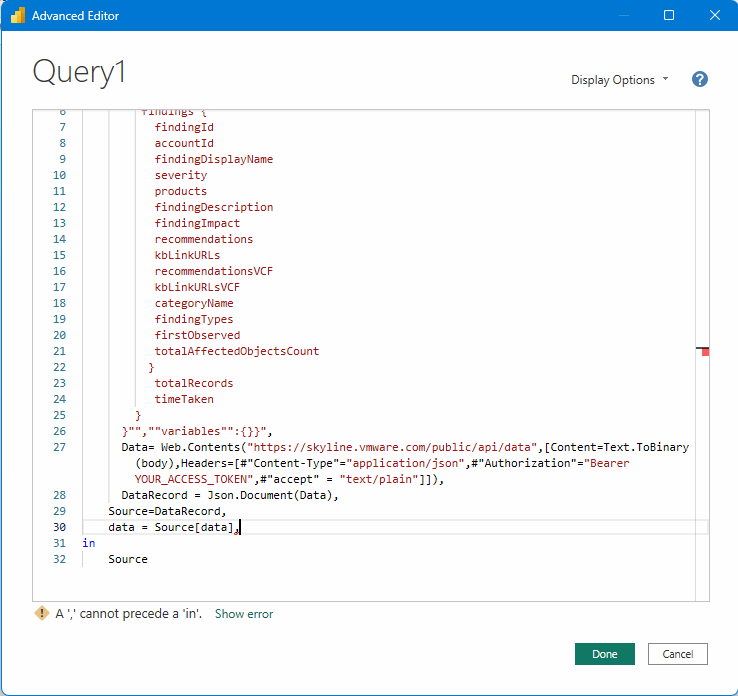
DataRecord = Json.Document(Data),
    Source=DataRecord,
    data = Source[data],
In this piece of code we are creating another variable, this time called ‘DataRecord’. The DataRecord variable is telling the query that we want the results to come back to us as a Json document and we want it to include the information collected in the ‘Data’ variable.
We are then going to assign the result of the DataRecord variable to the ‘Source’ variable. A new ‘data’ variable is created which is going to include the Source.
Our query should now be looking similar to below
Organising the data in PowerBI
The last part of this query is where we start to transform the data collected within PowerBI
activeFindings = data[activeFindings],
    findings = activeFindings[findings],
    #"Converted to Table" = Table.FromList(findings, Splitter.SplitByNothing(), null, null, ExtraValues.Error),
    #"Expanded Column1" = Table.ExpandRecordColumn(#"Converted to Table", "Column1", {"findingId", "accountId", "findingDisplayName", "severity", "products", "findingDescription", "findingImpact", "recommendations", "kbLinkURLs", "recommendationsVCF", "kbLinkURLsVCF", "categoryName", "findingTypes", "firstObserved", "totalAffectedObjectsCount"}, {"findingId", "accountId", "findingDisplayName", "severity", "products", "findingDescription", "findingImpact", "recommendations", "kbLinkURLs", "recommendationsVCF", "kbLinkURLsVCF", "categoryName", "findingTypes", "firstObserved", "totalAffectedObjectsCount"}),
    #"Expanded products" = Table.ExpandListColumn(#"Expanded Column1", "products"),
    #"Extracted Values" = Table.TransformColumns(#"Expanded products", {"recommendations", each Text.Combine(List.Transform(_, Text.From)), type text}),
    #"Extracted Values1" = Table.TransformColumns(#"Extracted Values", {"kbLinkURLs", each Text.Combine(List.Transform(_, Text.From)), type text}),
    #"Extracted Values2" = Table.TransformColumns(#"Extracted Values1", {"recommendationsVCF", each Text.Combine(List.Transform(_, Text.From)), type text}),
    #"Extracted Values3" = Table.TransformColumns(#"Extracted Values2", {"kbLinkURLsVCF", each Text.Combine(List.Transform(_, Text.From)), type text}),
    #"Extracted Values4" = Table.TransformColumns(#"Extracted Values3", {"findingTypes", each Text.Combine(List.Transform(_, Text.From)), type text})
The data received from the API query has come into PowerBI as a list. A list can be useful in some circumstances but we actually need it as a table so that we can use the data in a report. So the first thing we need to do is perform a convert from list to table.
Once this is converted into a table, we would have a single column where each collected record would just have an entry of record, so the next step is to expand the column that has been created to see what other data we have available.
We now have a lot of columns showing in our table, which should equate to the same names we entered in the ‘body’ variable earlier. If we were to look across to the ‘products’ column, we would see that we just have entries called ‘List’, so the next step is going to expand that list. That column should now show the names of the endpoints from Skyline. This will have created multiple entries for each finding, one for each endpoint associated with the finding.
If we were to look through the next step in the query, you would see that there is a list associated with ‘recommendations’, ‘kbLinkURLs’, ‘recommendationsVCF’, ‘kbLinkURLsVCF’ and ‘findingTypes’. The final parts of the code above expand each of these lists to allow us to see all of the data.
Your query should now look similar to below
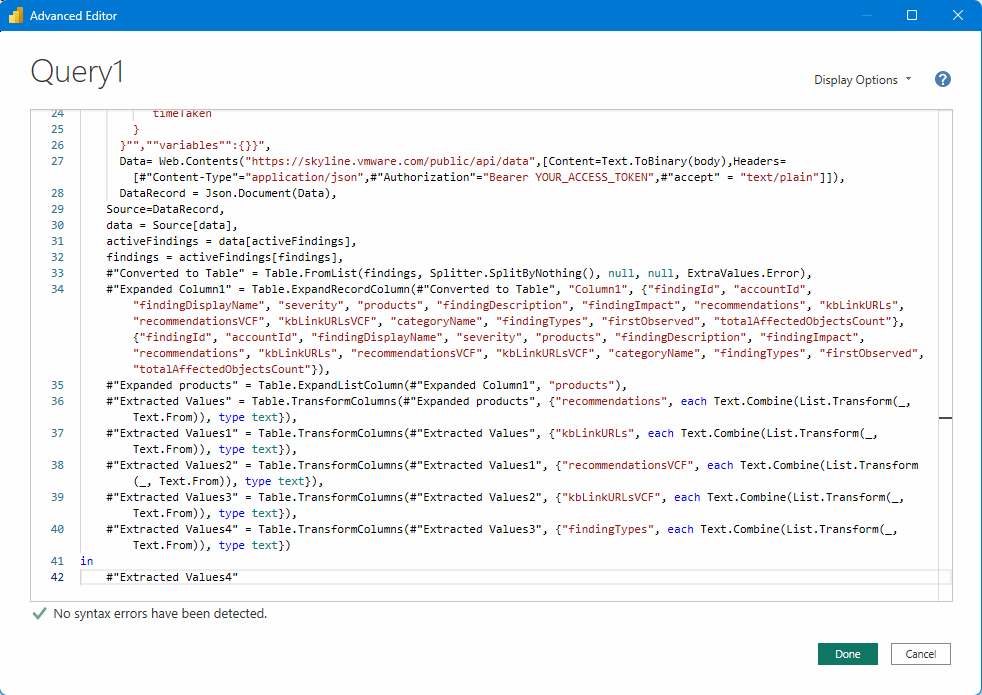
You may also notice that the final change that has been made to the very last line of the query is that ‘Source’ has now been changed over to the name of the last step in our query, so this now reads: #”Extracted Values4″
You should also notice that now that the entire code is entered into the Advanced Editor, there are no syntax errors detected, so from a coding point of view, the code is valid.
If you click ‘Done’, you can then right mouse click on ‘Query1’ in the Power Query Editor and rename the query to ‘Skyline_Finding_Data’.
If you have entered the code correctly, and with a value access_token, you should now see a table in the main part of the Power Query Editor showing a list of the findings that are currently triggered by that Skyline entity.
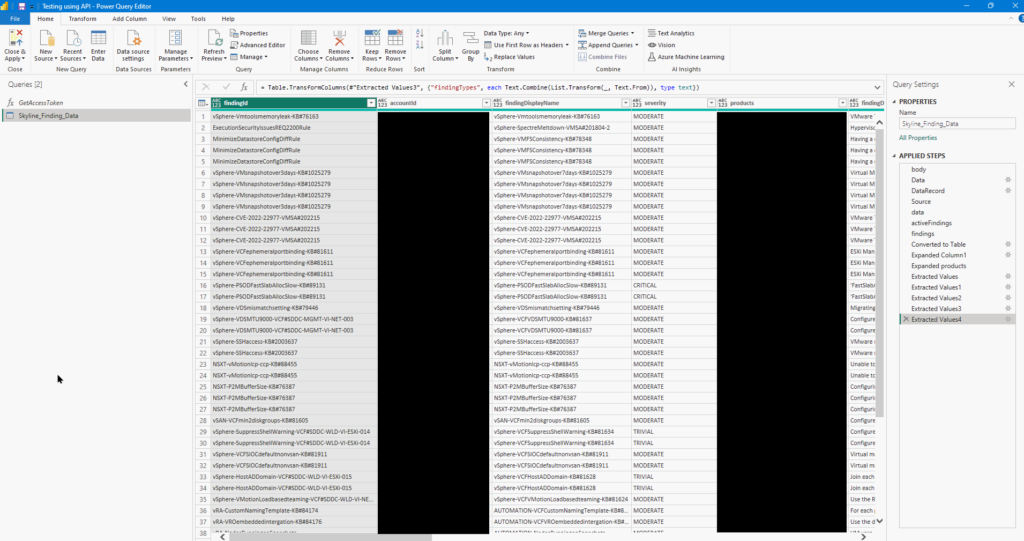
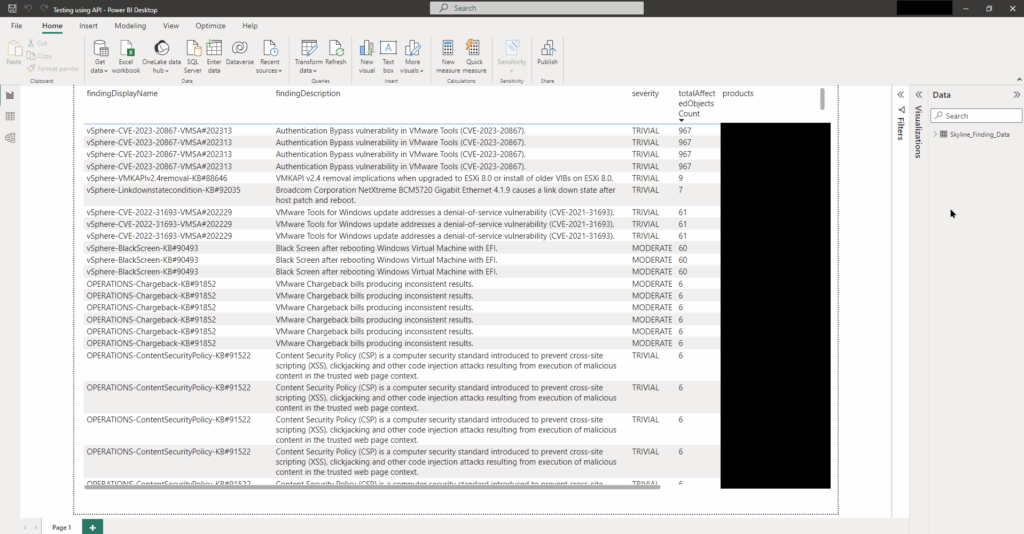
As some of the information is sensitive, I’ve blocked out those elements. If everything is looking good, then you can click the ‘Close & Apply’ button at the top of the screen which will then close the Power Query Editor, return you to the PowerBI desktop screen but will also update the available data with the ‘Skyline_Finding_Data’ query we have just created. You could then create tables and reports using the data, which could start looking similar to below
The full code is provided below but please remember that the ‘YOUR_ACCESS_TOKEN’ entry needs to be updated with your time sensitive access token before trying to refresh the data. Failure to do so, will result in access being denied and errors received when trying to refresh the data.
The full query code is provided below.
Full Query Code
let
     body = "{
       ""query"":""
         {
       activeFindings(limit: 1000) {
         findings {
           findingId
           accountId
           findingDisplayName
           severity
           products
           findingDescription
           findingImpact
           recommendations
           kbLinkURLs
           recommendationsVCF
           kbLinkURLsVCF
           categoryName
           findingTypes
           firstObserved
           totalAffectedObjectsCount
          }
           totalRecords
           timeTaken
        }
      }"",""variables"":{}}",
      Data= Web.Contents("https://skyline.vmware.com/public/api/data",[Content=Text.ToBinary(body),Headers=[#"Content-Type"="application/json",#"Authorization"="Bearer YOUR_ACCESS_TOKEN" ,#"accept" = "text/plain"]]),
    DataRecord = Json.Document(Data),
    Source=DataRecord,
    data = Source[data],

    activeFindings = data[activeFindings],
    findings = activeFindings[findings],
    #"Converted to Table" = Table.FromList(findings, Splitter.SplitByNothing(), null, null, ExtraValues.Error),
    #"Expanded Column1" = Table.ExpandRecordColumn(#"Converted to Table", "Column1", {"findingId", "accountId", "findingDisplayName", "severity", "products", "findingDescription", "findingImpact", "recommendations", "kbLinkURLs", "recommendationsVCF", "kbLinkURLsVCF", "categoryName", "findingTypes", "firstObserved", "totalAffectedObjectsCount"}, {"findingId", "accountId", "findingDisplayName", "severity", "products", "findingDescription", "findingImpact", "recommendations", "kbLinkURLs", "recommendationsVCF", "kbLinkURLsVCF", "categoryName", "findingTypes", "firstObserved", "totalAffectedObjectsCount"}),
    #"Expanded products" = Table.ExpandListColumn(#"Expanded Column1", "products"),
    #"Extracted Values" = Table.TransformColumns(#"Expanded products", {"recommendations", each Text.Combine(List.Transform(_, Text.From)), type text}),
    #"Extracted Values1" = Table.TransformColumns(#"Extracted Values", {"kbLinkURLs", each Text.Combine(List.Transform(_, Text.From)), type text}),
    #"Extracted Values2" = Table.TransformColumns(#"Extracted Values1", {"recommendationsVCF", each Text.Combine(List.Transform(_, Text.From)), type text}),
    #"Extracted Values3" = Table.TransformColumns(#"Extracted Values2", {"kbLinkURLsVCF", each Text.Combine(List.Transform(_, Text.From)), type text}),
    #"Extracted Values4" = Table.TransformColumns(#"Extracted Values3", {"findingTypes", each Text.Combine(List.Transform(_, Text.From)), type text})
in
    #"Extracted Values4"
A good source for going through the process of downloading general data using an API into PowerBI can be found here: https://www.thedataschool.co.uk/james-fox/load-an-api-into-power-bi-and-create-your-first-visualisation-in-5-steps/
Some of the creation of this query was aided by the information provided here: https://community.fabric.microsoft.com/t5/Desktop/Pull-data-from-API-using-POST-method-in-Power-BI/m-p/574727
Good information to know is that GraphQL (which is used by Skyline) is not the same as a REST API. The GraphQL requires the query to include just the information that you need rather than everything… a good description about GraphQL is provided here, although I didn’t ultimately use the method described in this blog post: https://ashiqf.com/2021/04/25/what-is-graphql-and-how-to-consume-a-graphql-query-based-api-in-power-automate/
This was another source used to help form the beginning part of the query: https://stackoverflow.com/questions/70523096/how-we-fetch-data-from-graphql-api-in-powerbi