
Skyline – Basic Power BI Report – Part 1
As you will have seen over my last few posts, I’ve been working with VMware Skyline a bit recently. I really like Skyline and believe that more companies should utilise it to provide proactive findings on their environments and to help avoid issues before they become and issue.
One area that Skyline has been lacking in the past is around the reporting side of things. This has gotten better as new updates are released but sometimes you just want to have more of a summary page to see what is going on in your environment or to be able to share with managers.
This blog post is designed to help you to create and provide a Basic Power BI Report utilising export data from Skyline. It’s a bit of a walkthrough document to produce something similar to the screenshot at the top of the blog but also serves as a starting point to enhance your Skyline reporting capabilities, with the limited data that is available through the export files from Skyline. You could look to add conditional colouring to the cells or lines based on Criticality; you could look to order the findings based on the number of affected objects; you could create sparklines to show how the number of affected objects per risk type change over time. There are so many different options available but we’ll start with the basics in this post and then you can enhance it however you wish.
Getting export files from Skyline
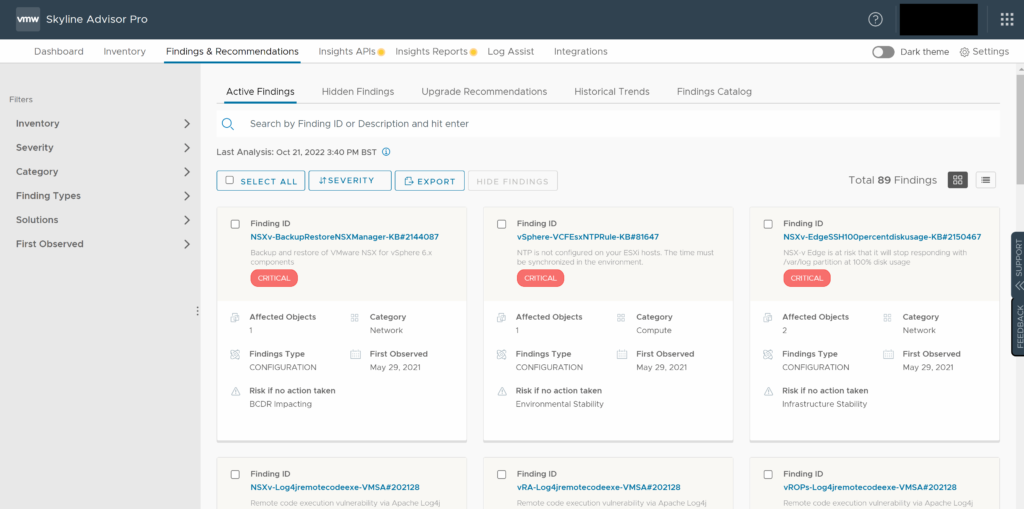
Before we leave Skyline Advisor, click the ‘Findings Catalog’ link at the top. This will take you to the full catalog of the findings available in Skyline at that time. If you scroll down to the bottom of the page, you will see that you are being shown findings 1-50 of the total number of findings. You should make a note of the total number of findings listed, as this will be used later to help work out the percentage of the Total findings that your findings represent. At the time of writing, the total number is 1076, although this number changes on a monthly basis.
Create the Folder Structure
We’re going to keep the folder structure quite simple but I would recommend creating a new folder to house the Power BI report, with a sub-folder that will house all of the Skyline exports that you’ll create over time. Once you have the folder structure created, make sure you move the export file you have just downloaded into that subfolder.
Create Your Power BI Parameters
We’re going to create the parameters that we’re going to need for the report (when creating your own reports in future, you may decide to create parameters at a later date to make data locations etc. customisable by your report users).
The steps that I will describe in this blog post will utilise Microsoft Power BI Desktop installed on a Windows 11 PC, although the method would be the same on a Windows 10 PC as well.
Start up Power BI Desktop and you’ll be presented with a blank starting screen, similar to below:
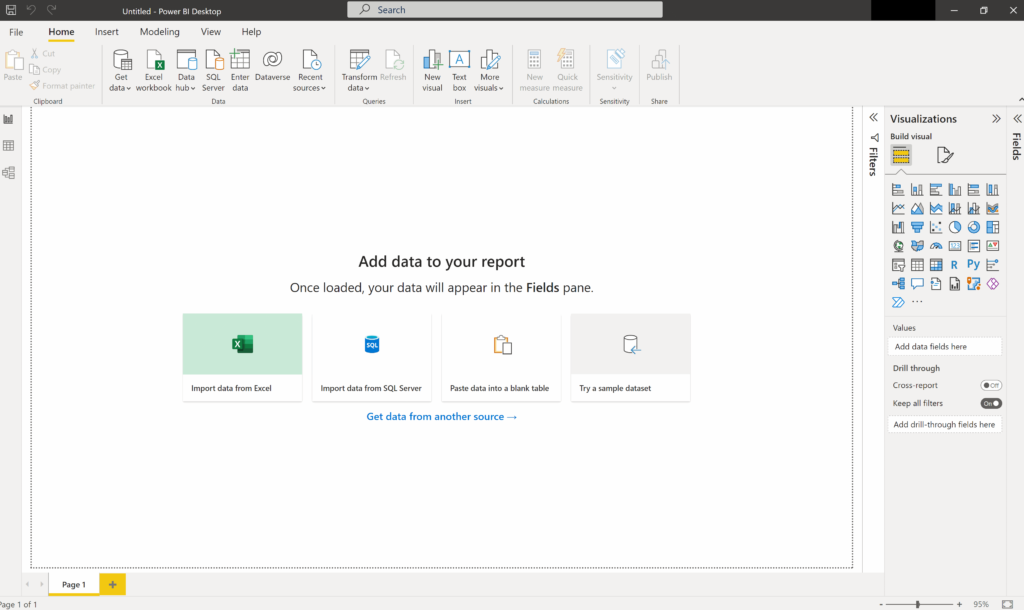
We’re primarily going to be using two main components of Power BI… the report/design screen shown above and the data transformation screen. The data transformation screen can be accessed by clicking the ‘Transform data’ button at the top of the screen… you should see something similar to below:
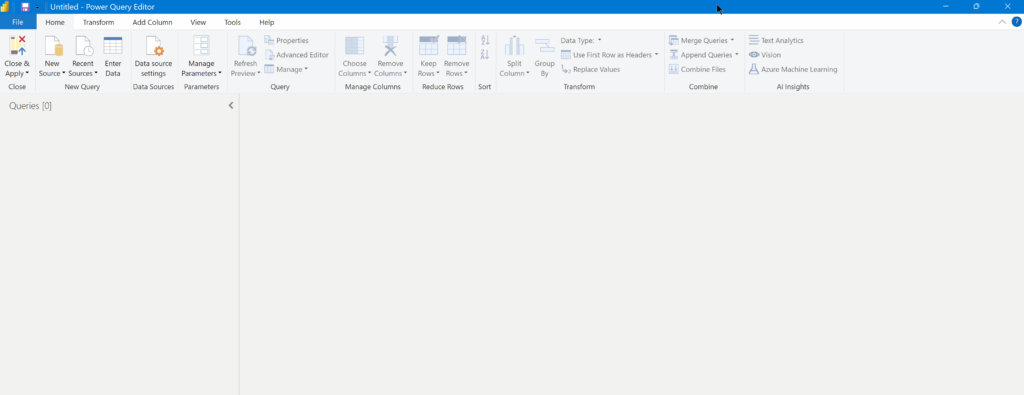
We now need to click on the ‘Manage Parameters’ option at the top of the screen to open the parameter management screen, as shown below:
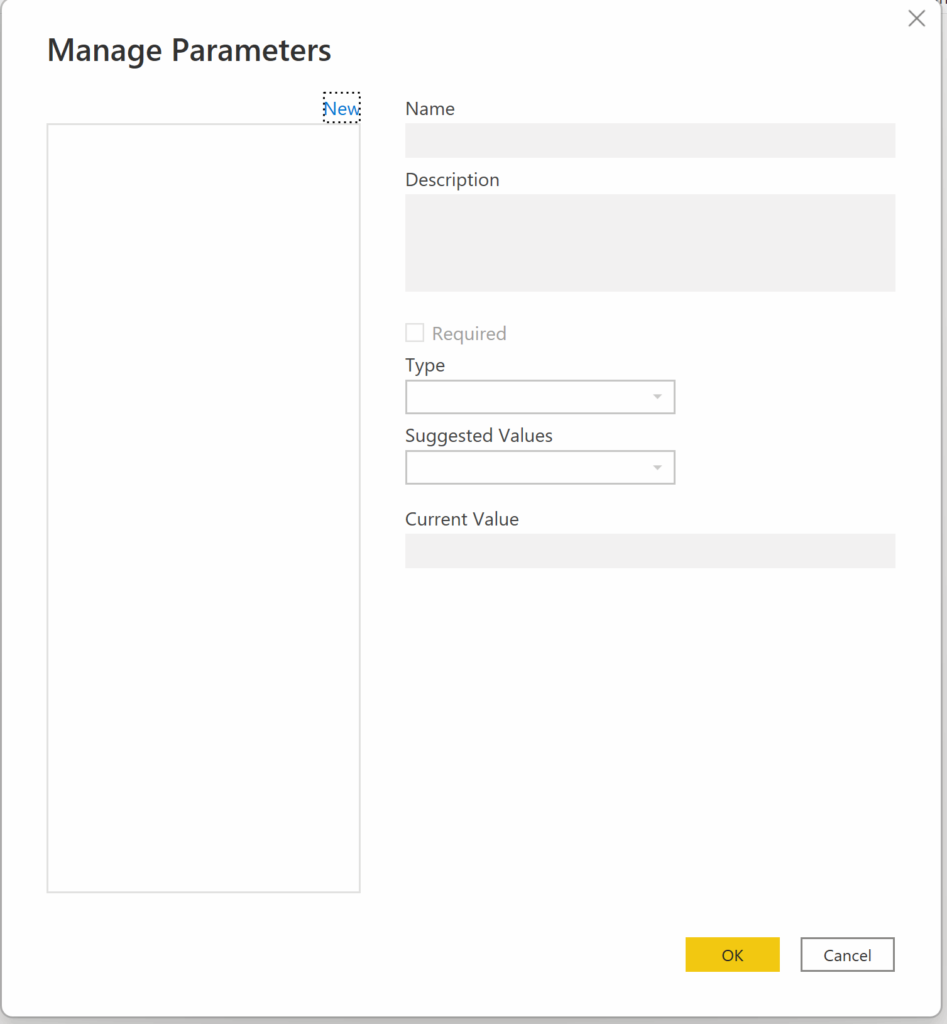
Hopefully, you’ve followed me so far. Now if you click on the ‘New’ link within the ‘Manage Parameters’ window, you’ll have the option to create the first parameter.
In this report, we’ll utilise two parameters. The first parameter is the total number of findings available in Skyline at that time. The second parameter will allow the user to enter the location where the Skyline export files are located.
Let’s start with the first of these parameters:
Under the Name box, enter: Number of Findings
You can enter a description of the parameter, if you wish.
Tick the box that says ‘Required’
In the Type drop-down box, select ‘Decimal Number’
In the Suggested Values drop-down box, select ‘Any value’
In the Current Value box, enter the current number of findings recorded earlier (if you remember at the time of writing this was 1076)
Once you have finished with that parameter, click the New link again to enter the second of our parameters with these settings:
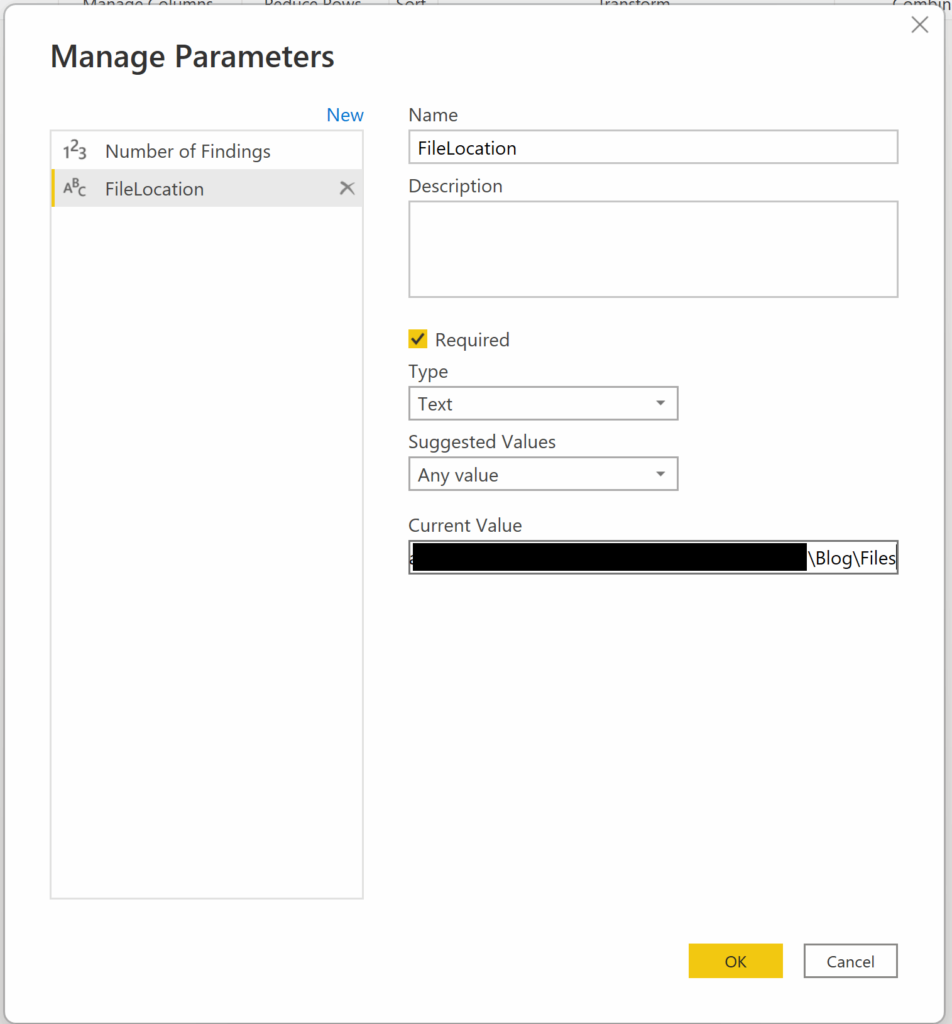
Under the Name box, enter: FileLocation
You can enter a description of the parameter, if you wish.
Tick the box that says ‘Required’
In the Type drop-down box, select ‘Text’
In the Suggested Values drop-down box, select ‘Any value’
In the Current Value box, enter the full path to where the export files are located. Do not include the specific export file name.
Once you have done with these, click ‘OK’ to accept them.
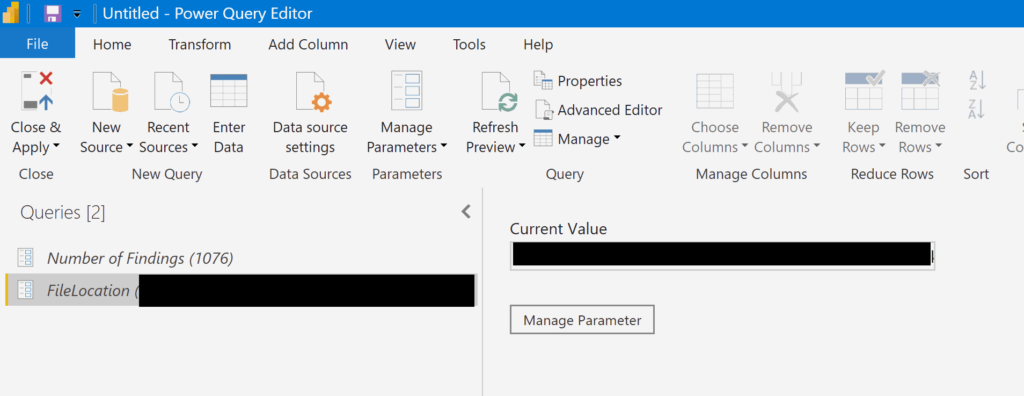
You will now also see the parameters listed under the ‘Queries’ section on the left.
Create Other Queries
With our parameters now in place, we can work on the additional queries that will be used to help present the data on screen.
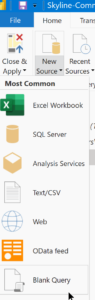
Whilst we are still in the ‘Power Query Editor’ that we used for the parameters, click the drop down link under ‘New Source’ and select ‘Blank Query’
We’re going to create a quick ‘Transform’ query using the ‘Advanced Editor’ capability before creating our main query further on in the blog post. This Transform query will help to transform the data as required as we step through the data manipulation later in the report.
With the blank query listed on the left, right mouse click on the query and then left click rename, and rename the query to be: Transform File
Right mouse click on the query again, then left click on ‘Advanced Editor’. A new page will open up, you should replace all of the text in the box with the following:
let
Source = (Parameter1 as binary) => let
Source = Csv.Document(Parameter1,[Delimiter=",", Columns=8, Encoding=1252, QuoteStyle=QuoteStyle.Csv]),
#"Promoted Headers" = Table.PromoteHeaders(Source, [PromoteAllScalars=true])
in
#"Promoted Headers"
in
Source
Repeat the process to create a new query. This time we want to rename the query to be called: Sample File
You should right mouse click on the new query, then left click on ‘Advanced Editor’. In the new page, replace all of the text in the box with the following:
let
Source = Folder.Files(FileLocation),
#"Sorted Rows" = Table.Sort(Source,{{"Date created", Order.Descending}}),
#"Filtered Rows" = Table.SelectRows(#"Sorted Rows", each not Text.StartsWith([Name], "~$") or not Text.EndsWith([Name], ".pbix")),
#"Kept First Rows" = Table.FirstN(#"Filtered Rows",1),
Navigation1 = #"Kept First Rows"{0}[Content]
in
Navigation1
Repeat the process to create a new query. With our blank query listed on the left, rename the query to be called: LatestFile
We can now use the query bar to add in a source, by entering the following into the query bar:
= Folder.Files(FileLocation)
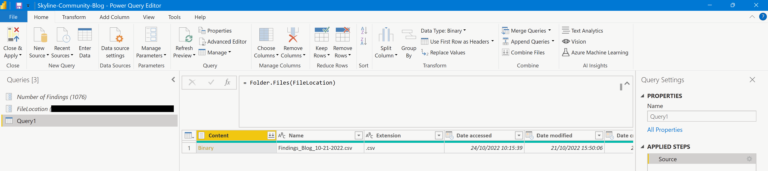
As you can see, after pressing enter, you’ll see the details of the file listed.
We’ll perform some additional formatting on the data that is now available from this source.
We’re going to sort the files by descending order by date, which isn’t a problem when there is a single file but when we have multiple files in the folder, we want to work with the latest file. Then we’re going to filter the files to only show .csv files (just in case you accidentally put other files in the same folder). Next, we’re going to only keep the first row, as we want to focus on the most recent file. We’ll then start to Transform the file so that we don’t look at the file information but instead the data within the file. We’ll rename some columns and remove columns that are no longer required, before expanding the data within the file and changing the column types to the relevant type for the data in each of the columns.
Each of the following lines will be an additional step on the query that we have been working on. To add a new step, right mouse click on the ‘Source’ applied step on the right of the screen and left click on ‘Insert Step After’. In the query bar, remove everything that is listed and replace it with the first line below.
= Table.Sort(Source,{{"Date modified", Order.Descending}})
Right mouse click on the step that has just been created, and then click ‘Rename’ and enter a new name for the step as: Sorted Rows
Create a new step, rename it as: Filtered Rows
Paste the following into the query bar:
= Table.SelectRows(#"Sorted Rows", each ([Extension] = ".csv"))
Repeat the process again, with the new step being renamed to: Kept First Rows
Paste the following into the query bar:
= Table.FirstN(#"Filtered Rows",1)
Repeat the process again, with the new step being renamed to: Filtered Hidden Files1
Paste the following into the query bar:
= Table.SelectRows(#"Kept First Rows", each [Attributes]?[Hidden]? <> true)
Repeat the process again, with the new step being renamed to: Invoke Custom Function1
Paste the following into the query bar:
= Table.AddColumn(#"Filtered Hidden Files1", "Transform File", each #"Transform File"([Content]))
Repeat the process again, with the new step being renamed to: Renamed Columns1
Paste the following into the query bar:
= Table.RenameColumns(#"Invoke Custom Function1", {"Name", "Source.Name"}) Repeat the process again, with the new step being renamed to: Removed Other Columns1
Paste the following into the query bar:
= Table.SelectColumns(#"Renamed Columns1", {"Source.Name", "Transform File"}) Repeat the process again, with the new step being renamed to: Expanded Table Column1
Paste the following into the query bar:
= Table.ExpandTableColumn(#"Removed Other Columns1", "Transform File", Table.ColumnNames(#"Transform File"(#"Sample File")))
Repeat the process again, with the new step being renamed to: Changed Type
Paste the following into the query bar:
= Table.TransformColumnTypes(#"Expanded Table Column1",{{"Source.Name", type text}, {"Finding Id", type text}, {"Issue Description", type text}, {"Severity", type text}, {"Number of Affected Objects", Int64.Type}, {"First Observed", type date}, {"Risk if no Action Taken", type text}, {"Recommendations", type text}, {"Reference", type text}}) At this point you should have something similar to below shown on screen, with all of the applied steps and the additional Transform File and Sample File queries.
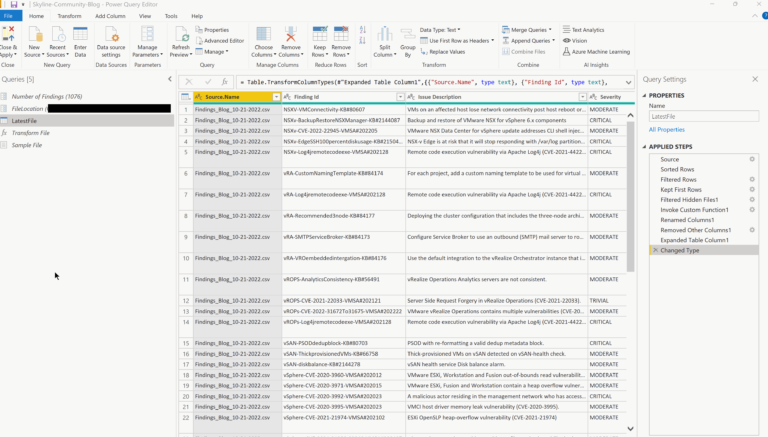
At this point you should remember to click the ‘Close & Apply’ button in the top left of the screen to return you to the Power BI report design screen, at which point you should also save the report to avoid losing any data.
This continues in Part 2 of this walkthrough which is available here: https://www.virtualworlduk.co.uk/wordp/?p=231022