
Skyline – Basic Power BI Report – Part 2
As you may recall, we’re part way through creating a Power BI report to display information collected from VMware Skyline. The first part can be found here: https://www.virtualworlduk.co.uk/wordp/?p=230985
In Part 1, we had downloaded the export from Skyline, and created some of the queries that gather the data from the exports ready to be used in the report components. This, primarily, resulted in us having the ‘LatestFile’ table available to be used in the Power BI designer page.
Two Additional Queries
To enable us to have some of the capabilities to show how the number of findings are changing over time, we need have a query to count the number of findings across each of the export files in our folder… this will be handled with one query. The second query will take the total number of findings that we enter as a parameter and utilise that on the page but then also utilise that information to help calculate the percentages used on the other charts.
Findings Count Query
To start this off we need to click the ‘Transform Data’ link at the top of the screen to go into the data transformation screen.
let
Source = Folder.Files(FileLocation),
#"Filtered Rows" = Table.SelectRows(Source, each ([Extension] = ".csv")),
#"Sorted Rows" = Table.Sort(#"Filtered Rows",{{"Date created", Order.Descending}}),
#"Kept First Rows" = Table.FirstN(#"Sorted Rows",6),
#"Filtered Hidden Files1" = Table.SelectRows(#"Kept First Rows", each [Attributes]?[Hidden]? <> true),
#"Invoke Custom Function1" = Table.AddColumn(#"Filtered Hidden Files1", "Transform File", each #"Transform File"([Content])),
#"Renamed Columns1" = Table.RenameColumns(#"Invoke Custom Function1", {"Name", "Source.Name"}),
#"Removed Other Columns1" = Table.SelectColumns(#"Renamed Columns1", {"Source.Name", "Transform File"}),
#"Expanded Table Column1" = Table.ExpandTableColumn(#"Removed Other Columns1", "Transform File", Table.ColumnNames(#"Transform File"(#"Sample File"))),
#"Filtered Rows1" = Table.SelectRows(#"Expanded Table Column1", each ([Issue Description] <> "")),
#"Changed Type" = Table.TransformColumnTypes(#"Filtered Rows1",{{"Source.Name", type text}, {"Finding Id", type text}, {"Issue Description", type text}, {"Severity", type text}, {"Number of Affected Objects", Int64.Type}, {"First Observed", type date}, {"Risk if no Action Taken", type text}, {"Recommendations", type text}, {"Reference", type text}}),
#"Split Column by Position" = Table.SplitColumn(#"Changed Type", "Source.Name", Splitter.SplitTextByPositions({0, 14}, true), {"Source.Name.1", "Source.Name.2"}),
#"Changed Type1" = Table.TransformColumnTypes(#"Split Column by Position",{{"Source.Name.1", type text}, {"Source.Name.2", type text}}),
#"Split Column by Position1" = Table.SplitColumn(#"Changed Type1", "Source.Name.2", Splitter.SplitTextByPositions({0, 10}, false), {"Source.Name.2.1", "Source.Name.2.2"}),
#"Renamed Columns2" = Table.RenameColumns(#"Split Column by Position1",{{"Source.Name.2.1", "Date"}}),
#"Split Column by Delimiter" = Table.SplitColumn(#"Renamed Columns2", "Date", Splitter.SplitTextByDelimiter("-", QuoteStyle.Csv), {"Date.1", "Date.2", "Date.3"}),
#"Reordered Columns" = Table.ReorderColumns(#"Split Column by Delimiter",{"Source.Name.1", "Date.2", "Date.1", "Date.3", "Source.Name.2.2", "Finding Id", "Issue Description", "Severity", "Number of Affected Objects", "First Observed", "Risk if no Action Taken", "Recommendations", "Reference"}),
#"Merged Columns" = Table.CombineColumns(#"Reordered Columns",{"Date.2", "Date.1", "Date.3"},Combiner.CombineTextByDelimiter("-", QuoteStyle.None),"Merged"),
#"Changed Type2" = Table.TransformColumnTypes(#"Merged Columns",{{"Merged", type date}, {"Source.Name.2.2", type text}}),
#"Renamed Columns" = Table.RenameColumns(#"Changed Type2",{{"Merged", "Date"}}),
#"Added Index" = Table.AddIndexColumn(#"Renamed Columns", "Index", 1, 1, Int64.Type),
#"Grouped Rows" = Table.Group(#"Added Index", {"Date"}, {{"Count", each Table.RowCount(_), Int64.Type}})
in
#"Grouped Rows"
Once this is done, click the ‘Done’ button and the code will be added to the query. The result of the query should be a column showing the Date and a column showing the count of findings.
Total Findings Query
The last of the queries that we need to create is the one to show the total number of findings as a numerical figure that we can then use in calculations later.
Create a new query, rename the query to be: TotalFindings
Right mouse click on the TotalFindings query and left click on ‘Advanced Editor’
Paste the following code into the advanced editor to create the TotalFindings query:
let
Source = Table.FromRows(Json.Document(Binary.Decompress(Binary.FromText("i45WMjUzV4qNBQA=", BinaryEncoding.Base64), Compression.Deflate)), let _t = ((type nullable text) meta [Serialized.Text = true]) in type table [#"Total Findings" = _t]),
#"Changed Type" = Table.TransformColumnTypes(Source,{{"Total Findings", Int64.Type}}),
#"Renamed Columns" = Table.RenameColumns(#"Changed Type",{{"Total Findings", "Old Total Findings"}}),
#"Removed Columns" = Table.RemoveColumns(#"Renamed Columns",{"Old Total Findings"}),
#"Added Custom" = Table.AddColumn(#"Removed Columns", "TotalFindings", each {#"Number of Findings"}),
#"Expanded TotalFindings" = Table.ExpandListColumn(#"Added Custom", "TotalFindings")
in
#"Expanded TotalFindings"
After clicking Done, the TotalFindings query should show a column named ‘TotalFindings’ with a figure underneath that matches the figure entered for the Number of Findings parameter we entered earlier.
You should now be able to click the ‘Close & Apply’ button to have the new queries transferred into the design space.
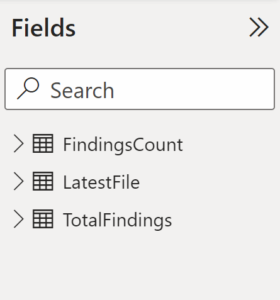
You should now see the following under the ‘Fields’ view:
Creating Measures
Although it seems like we are having to do a lot of prep work before getting into creating the actual report, we are laying the foundations to the report we want to create.
During the initial creation of this report, I had a rough idea of what I wanted to create and would create some visuals on the report and then make the measures and queries to match what I wanted to show. For this walkthrough, I’ve adjusted the order slightly to get most of the items created up front and then the final stage is to create the visuals.
The majority of the measures we are going to create are going to be added to the ‘TotalFindings’ query, as they are calculations taken from that table to help show percentages in pie charts and coloured sections of the pie charts.
To create a measure, you should move your mouse over the ‘TotalFindings’ query under the ‘Fields’ area and then click on the ‘…’ (three dots at the right of the name), this will open a menu and you should then click ‘New Measure’. This will create a new code entry box at the top of the report window. Enter a piece of code below, press enter to accept the code, then create a new measure before entering the next piece of code.
%AllFindings =

VAR __TotalFindings = ('TotalFindings'[Total Findings])

VAR __FindingCount = COUNT('LatestFile'[Severity])

VAR __Remainder = __TotalFindings-__FindingCount

RETURN FORMAT(DIVIDE(__Remainder,__TotalFindings),"0.00%")
Throughout the code entry in the measures both above and below, do not be concerned if you receive an error. This is just that it is calling on a measure that you haven’t created yet.
%Critical = FORMAT(DIVIDE(COUNTROWS(FILTER('LatestFile','LatestFile'[Severity]="CRITICAL")),COUNTROWS('LatestFile')),"0.00%")%Moderate = FORMAT(DIVIDE(COUNTROWS(FILTER('LatestFile','LatestFile'[Severity]="MODERATE")),COUNTROWS('LatestFile')),"0.00%")%TotalFindings = FORMAT(DIVIDE(COUNT('LatestFile'[Severity]),'TotalFindings'[Total Findings]),"0.00%")%Trivial = FORMAT(DIVIDE(COUNTROWS(FILTER('LatestFile','LatestFile'[Severity]="TRIVIAL")),COUNTROWS('LatestFile')),"0.00%")Critical = COUNTROWS(FILTER('LatestFile','LatestFile'[Severity]="CRITICAL"))CriticalLeft = COUNT('LatestFile'[Severity])-[Critical]Moderate = COUNTROWS(FILTER('LatestFile','LatestFile'[Severity]="MODERATE"))ModerateLeft = COUNT('LatestFile'[Severity])-[Moderate]Other Findings = 'TotalFindings'[Total Findings]-COUNT('LatestFile'[Severity])Total Findings = CALCULATE(MAX('TotalFindings'[TotalFindings]))Trivial = COUNTROWS(FILTER('LatestFile','LatestFile'[Severity]="TRIVIAL"))TrivialLeft = COUNT('LatestFile'[Severity])-[Trivial]The final measure to create is one on the ‘FindingsCount’ query. Click the ‘…’ next to the FindingsCount name in the ‘Fields’ area of the screen and then left click on ‘New Measure’. Enter the following code for that measure in the measure box:
CountItems = COUNT(FindingsCount[Date].[Date])
There is one additional item that we need to add and this is a column. This is performed in much the same way as creating a measure except this will add a column to query based on a calculation rather than a single entry.
We’ll be adding this column to the ‘TotalFindings’ query and therefore click the ‘…’ next to the TotalFindings name in the ‘Fields’ area of the screen and then left click on ‘New Column’. A code box will appear in the same place as the measure code box would normally appear, you should enter the following code into that box:
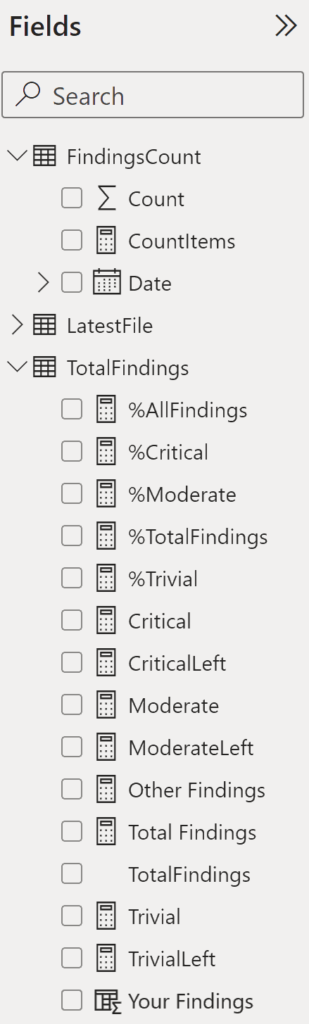
Your Findings = COUNT('LatestFile'[Severity])After all of this work you should have something similar to below:
Now we are ready to create some visuals.
Part 3 of this walkthrough continues at the following link: